Joe Bonem introduces terminology and calculation approaches for dilute phase pneumatic conveying, highlighting the significance of saltation velocity
About the author
Joe Bonem is a Senior Technical Consultant at the Rosnik Solutions LLC. Joe’s 5-decade career included all phases of chemical engineering from technology to plant problem solving. His activities at the time of retirement from ExxonMobil were focused on chronic and seemingly unsolvable problems. Joe has authored 3 books – Process Engineering Problem Solving, Problem Solving for Process Operators and Specialists and Chemical Projects Scale Up: How to go from Laboratory to Commercial
INTRODUCTION
Solids conveying is used throughout the industrial and business world. It is used from drive-through banking depositing to heavy industry. While the pneumatic design can vary from dilute phase to dense phase and from vacuum systems to pressure system, this paper deals with pressurized dilute phase system concepts. These concepts will be helpful in both design and problem-solving areas. The paper contains guidelines, conclusions and the results of calculations. These calculated values are based on proprietary correlations and the Rikz relationship. These proprietary correlations have been validated in commercial operations of a pressurized transfer system with a length of 400 feet as well as limited laboratory data. Wherever possible the correlations have been confirmed by actual plant data.
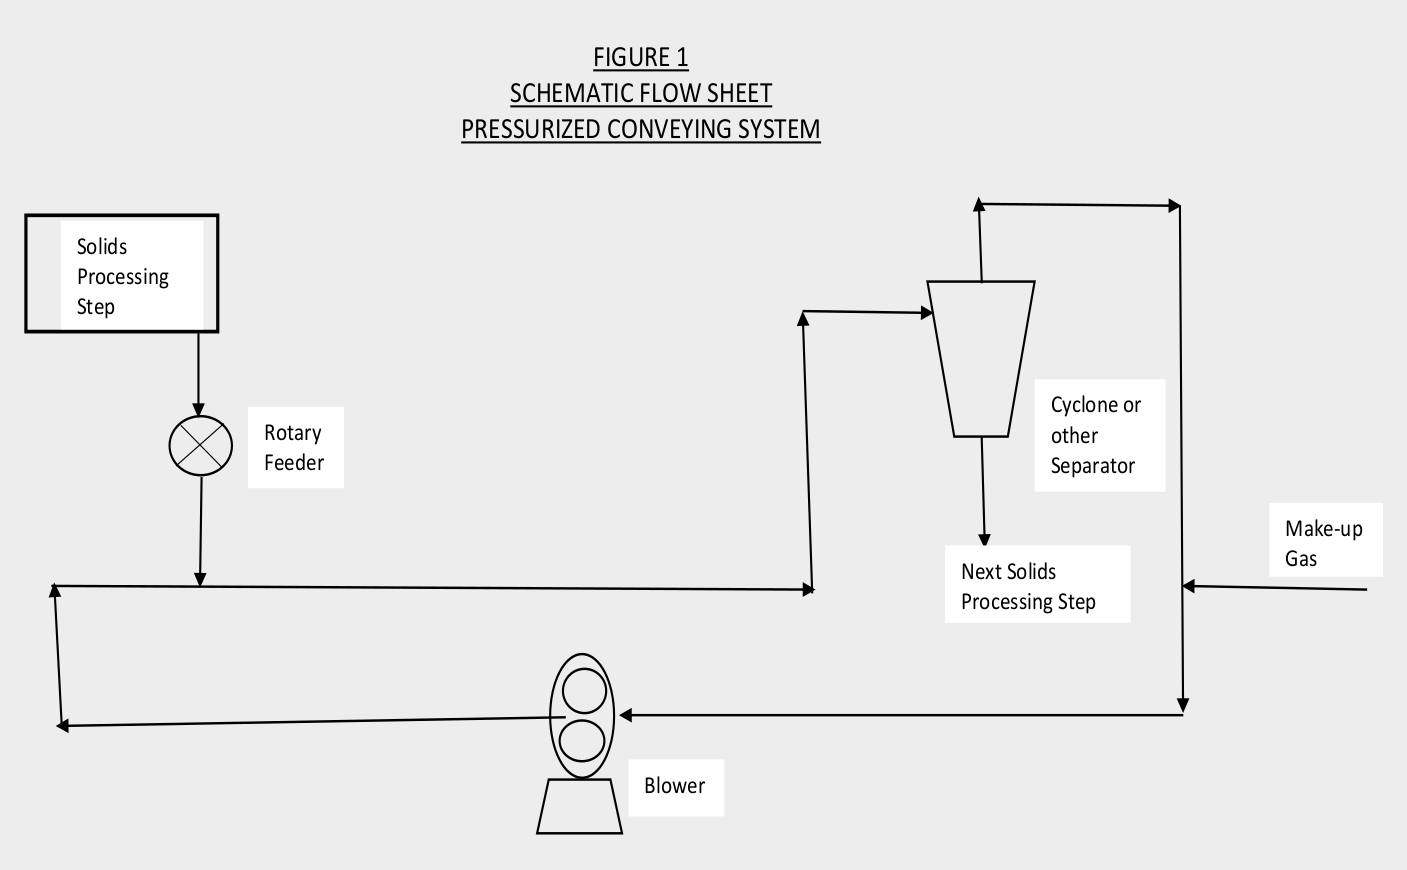
The physical properties of the solid being conveyed are those of a spherically shaped polyolefin. It is not known to what extent the correlations are valid for other solids. The paper is focused on systems where the gas is either nitrogen or air. However, the concepts are valid for other gases. The dilute phase pressurized system is generally one where the solid to gas ratio is less than 5 pounds of solids per pound of gas. Although there are literature references of a solid to gas ratio being as high as 10. Pressurized systems are defined as a system where the final pressure is above atmospheric pressure. The initial pressure will then depend on pressure drop in the conveying system. An example of this system in Figure 1. When considering the dilute phase pressurized system shown in Figure 1, there are 4 major components that each can contribute to the success or failure of a system. They are:
A means to transfer the solids from a lower pressure to the higher pressure conveying system. This can be a rotary feeder or a screw conveyer. The system shown here is a rotary feeder. There are also cases where the solids are at higher pressure and a rotary feeder or valving system Is used to control the solids flow.
A blower to provide the energy necessary to move the solids to the next processing step. The system shown here is a typical closed loop nitrogen system where the nitrogen is returned to the suction side of the blower. However, an air conveying system would be similar except the return line would not be required. The blower intake would simply be surrounding air.
Piping to transfer the dilute phase to the next processing step. While the piping layout may seem trivial, it is very important in solids conveying as discussed later.
The final separation of the solids from the conveying gas which is usually done by a cyclone or “dust collector”.
An engineer confronted with the design or problem solving associated with the system shown in Figure 1 struggles because relative to more traditional engineering aspects, the technology is not well defined, not easily available and not covered in the academic world. The purpose of this paper is to introduce the non-expert to terminology and calculation approaches for dilute phase pneumatic conveying. Because the some of the calculations use proprietary correlations, only the results of the calculations are show. However, the author is available for consulting in the discussed field.
The paper presents results of calculations for important criteria such as required velocity to suspend the particles and pressure drop in the system. In addition to results of calculations, there are guidelines and values provided that will aid in the design and problem solving of these dilute phase transfer systems.
While the thrust of this paper is a solids conveying system handling air or nitrogen, the same concepts would apply to systems where the gas is a hydrocarbon. For example, in the production of polyolefins, the effluent from a reactor often flows from high pressure to a lower pressure where the motive force is provided by vaporizing liquid from a liquid phase reactor or reactor gas from a gas phase reactor.
KEY CONCEPTS
The Key Concepts consist of the following:
Gas Rate – This is the linear velocity of the gas based on the total cross sectional area of the pipe.
Solids to Gas Ratio-This is normally expressed in weight terms such as lbs. solids/lb. gas. However, other units are often used. The key to remember is to confirm what units are being used.
Solids Entrance Design- The solids entrance design to the gas stream is important to get the solids moving in the direction of the gas stream. In addition, the conveying gas that fills the rotary feeder must be vented. These features are described later.
Piping Design – The key to a successful piping design is to minimize elbows. The pressure drop in elbows is discussed later.
Pressure Drop in piping – The presence of solids in the 2 phase flow increases the pressure drop particularly in elbows.
These areas are discussed in the following paragraphs.
GAS RATE
The gas rate must be high enough so that the solids move uniformly. While dense phase transfer is a mechanism where the solids flow rate varies with time, in dilute phase flow the solids flow rate to a receiving vessel is reasonably constant. This does not necessarily mean that the solids are traveling at the same velocity as the gas This difference between gas velocity and solids velocity is referred to as slip velocity. Gas flow rate is the most important criteria to assure that the solids flow rate to the receiving vessel is constant.
Gas flow rate should be above the saltation velocity. Saltation velocity is defined as the minimum velocity in horizontal piping to provide the constant solids rate to the receiving vessel. A typical calculated saltation velocity is 60-85 fps. This is for a nitrogen/air system conveying polyolefin particles with a diameter of 700-1500 microns at pressures less than 10 psig. This calculated saltation velocity is generally increased by 15-25% to insure the successful design of the conveying system. Figure 3 shows the effect of particle diameter on estimated saltation velocity for the described system. The figure shows two different correlation – the Rizk correlation and a proprietary relationship. As can be seen in Figure 3 the two equations diverge as the particle diameter increases.
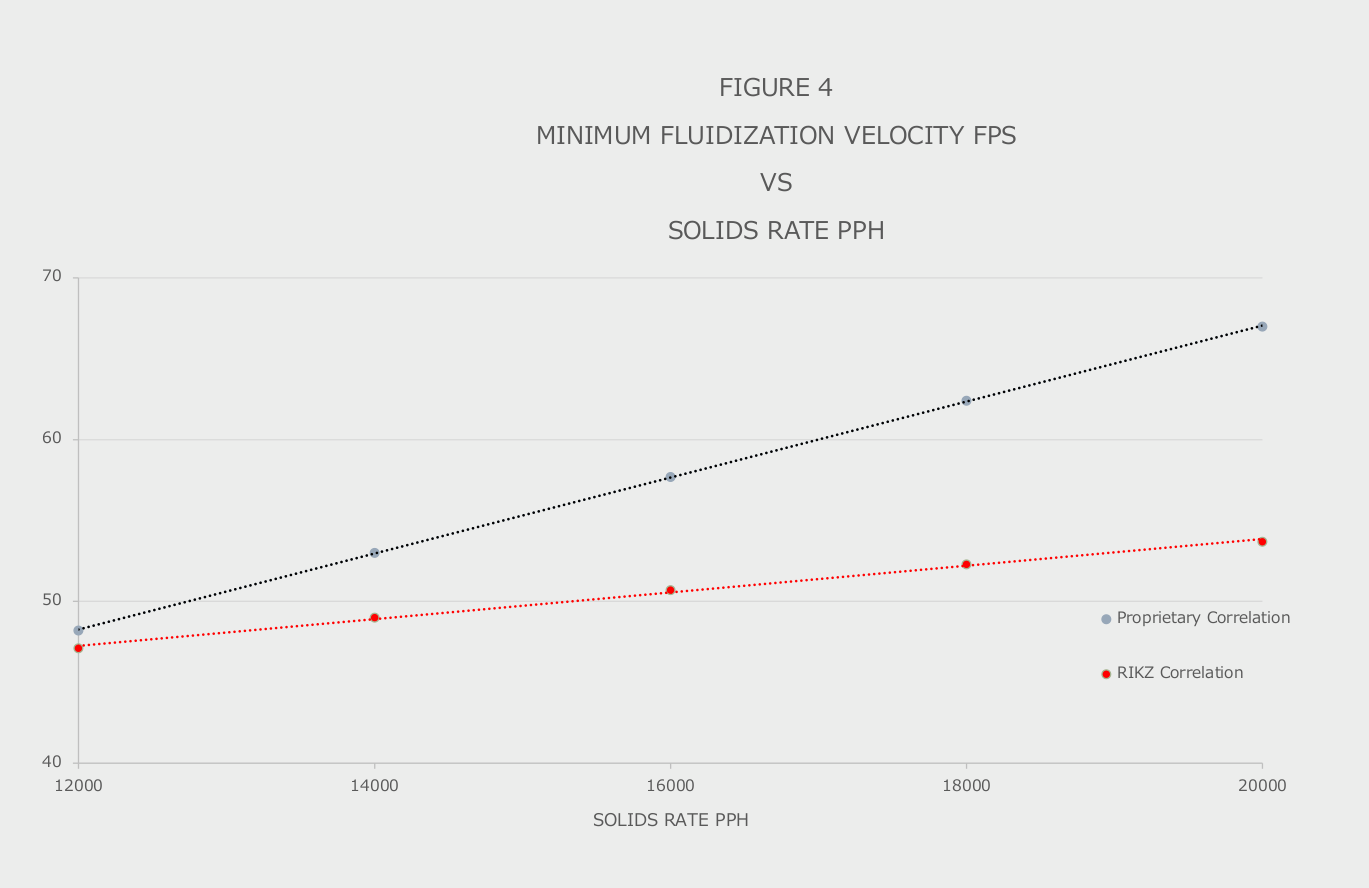
The Rizk correlation and proprietary correlation were also used to predict the effect of solids rate. Figure 4 shows the saltation velocity as a function of solids rate at a constant gas rate. Similar calculations indicate that the proprietary correlation shows that particle density has little effect on saltation velocity. This statement seems counter intuitive. It may be associated with the compensating effects that the denser single particle and lower volumetric solids flow have on the saltation velocity or it may be a quirk associated with the correlation.
The fact that these two correlations diverge as shown in Figure 3 is not surprising. The subject of minimum saltation velocity is so complex that experts in the field often indicate that experimental work is the only way to accurately predict it. The Rizk relationship published by F.Rizk is shown
Where:
Fr = The calculated Froude number
Ø = The solids loading in wt. solids/wt. gas
g = gravitational constant 9.81 m/sec 2
D = Pipe diameter in meters
d = particle diameter in mm
V = Saltation velocity in m/sec
While saltation velocity is associated with horizontal flow, the comparable term for vertical flow is “choke factor”. If the gas flow rate does not provide a choke factor above the minimum, solids will tend to build up in the bottom of the vertical riser and then surge into the receiving vessel. In the cases shown here, the saltation velocity is always greater than the velocity required to avoid choking.
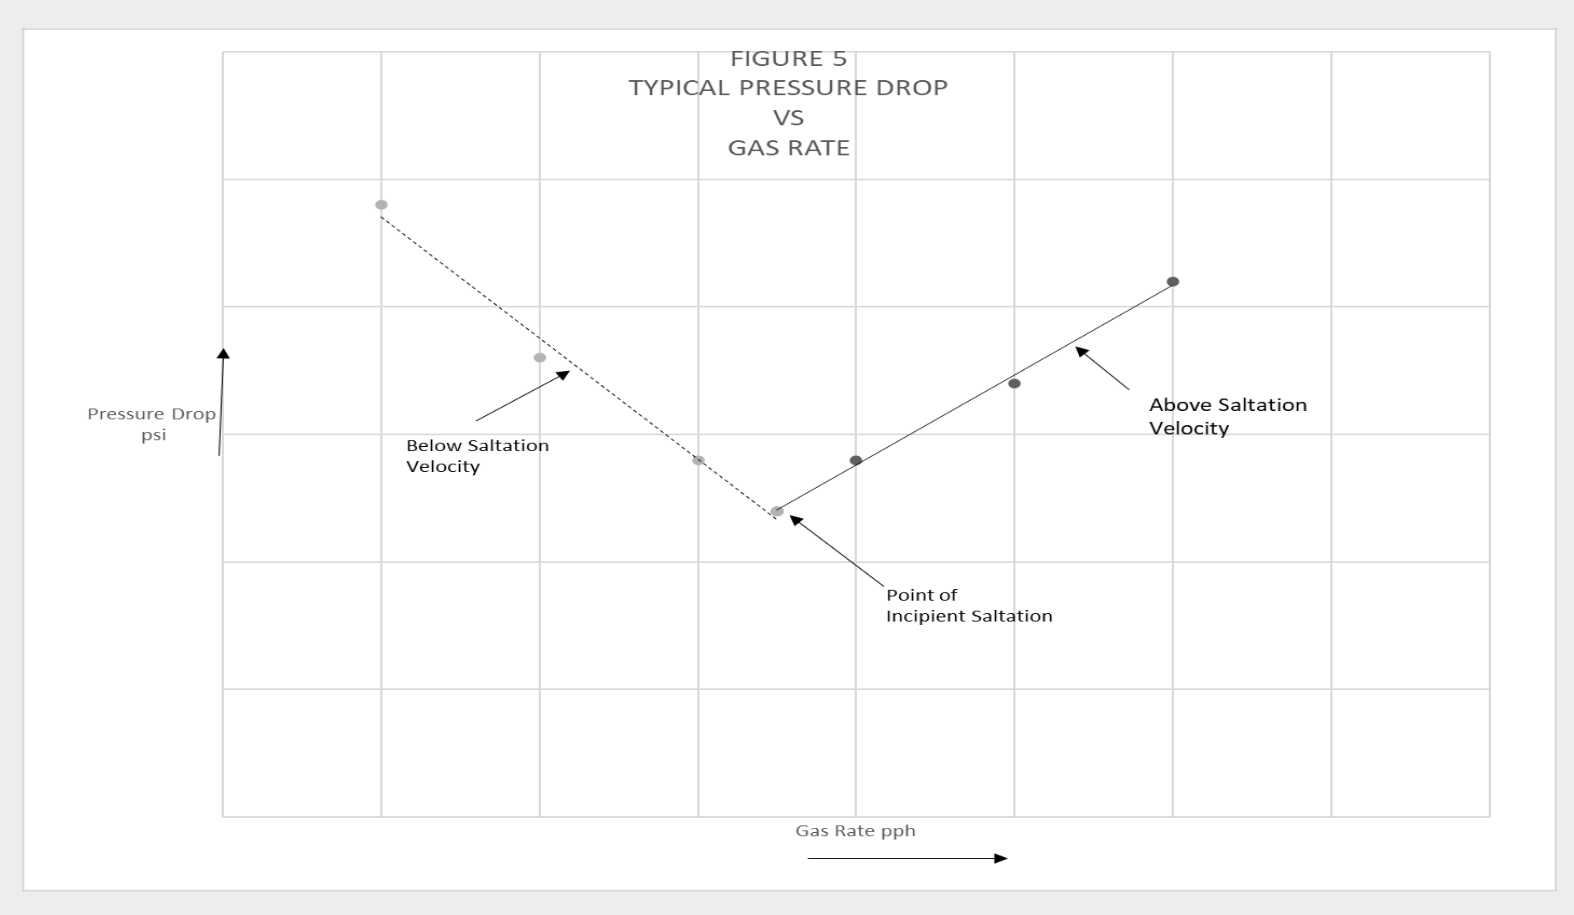
In an operating facility, it is often difficult to know if saltation is occurring. Figure 5 shows pressure drop in the conveying line as a function of gas rate. As shown in this figure, there is a minimum point. The minimum point in this figure is generally considered the point of incipient solids saltation. Incipient solids saltation is defined as the point where the lines shown in Figure 5 intersect. As shown in this figure, as the gas flow is decreased from the highest rate shown on the right of Figure 5, the pressure drop decreases until the minimum pressure drop is reached. At this point, significant solids settling begins. As the gas rate continues to be decreased, the solids level builds in the pipe and begins to restrict the gas flow causing the pressure drop to increase. Conversely as the gas flow rate is increased from the left side of the figure, the restricted area decreases as the flow is increased and the solids slide along the bottom of the pipe. As the gas rate continues to increase, the depth of solids in the pipe decreases and the area of gas flow increases. This results in a decrease in pressure drop. At the point of incipient saltation, the solids begin to be picked up into the gas stream. However, there will still be a layer of solids sliding along the pipe. As the gas rate is increased more solid fluidization occurs and the solids are eventually uniformly disbursed in the flowing gas stream. The point where most of the solids are disbursed in the conveying gas is defined as the saltation velocity. If the gas rate is increased further, the pressure drop will continue to increase.
It might seem appropriate to be conservative and design the gas rate to be well above the saltation velocity. However, besides wasting funds in overdesign of the system, there is a risk of the higher velocity causing the temperature of the solid particles to increase past the softening point. At elbows the particles approach a complete stop and the kinetic flowing energy is converted to heat. If this heat is not quickly dispersed throughout the particle, some of the particle surface may be in the semi-melt phase. These particles with melted surface may create agglomerates or other types of irregular particles.
The particles that slow down at the elbows must then be reaccelerated to the velocity of the solids. This reacceleration creates additional pressure drop. So, any excess gas rate causes both an increase in pressure drop associated with reacceleration at elbows and pressure drop associated with the higher gas rates. The increased pressure drop in the piping and reacceleration at elbows will lead to higher pressure at the entrance from the rotary feeder. This increased pressure will increase the amount of conveying gas trapped in the empty pocket of the rotary feeder. Enhanced facilities must be provided for venting this gas.
SOLIDS TO GAS RATIO
The amount of solids being conveyed with a fixed amount of gas can impact the pressure drop. Several cases were run to show the impact of the solids rate on the estimated pressure drop using the proprietary relationship. Table 1 shows this along with estimated saltation velocity for the various solids rates. Table 1 also shows the ratio of two phase (gas and solids) pressure drop to gas only pressure drop. The relative pressure drops are shown below:
Piping Configuration
Ratio of Pressure Drop for Two Phases/Gas only
Horizontal Pipe
1.5 to 1.9
Vertical Pipe
1.9 to 2.5
Elbows or Bends
5.7 to 8.8
This summary shows the importance of elbows or bends in a piping layout. Table 2 shows the basis for these calculations.
SOLIDS ENTRANCE DESIGN
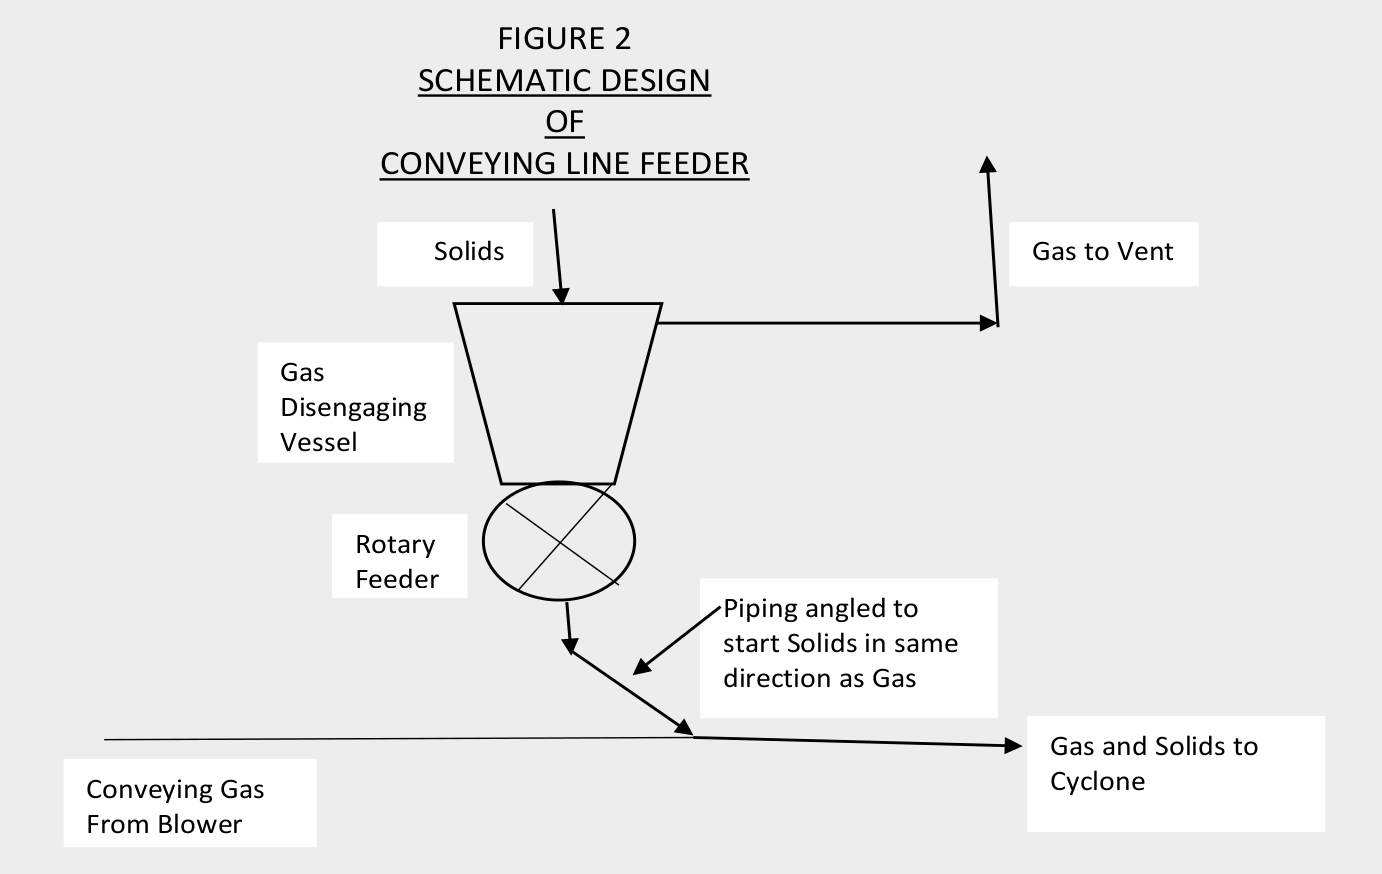
The optimum design of solids entrance into the flowing gas stream is shown schematically in Figure 2. In a pressurized system the rotary feeder pocket will fill with gas as the solids are discharged and flow into the conveying gas stream. This gas will be vented as rotary feeder rotates and solids flow into the pocket. If the solids are small enough, this vented gas will fluidize them and they will be held up in the standpipe. Eventually they will dump into the rotary feeder. This unsteady state creates fluctuating solids flow which can cause the dilute phase system to plug. The vessel design shown in Figure 2 should be large enough to allow the gas to disengage from the solids and vent to a proper location. Figure 2 also shows a sloped solids entrance that will assist in starting the solids flow into the flowing gas stream in the same direction as the flowing gas.
PIPING DESIGN
The piping design for dilute phase solids conveying is very important. The two most important guidelines are;
Piping runs must be either horizontal or vertical. Inclined piping runs have been shown to have 30% higher pressure drop than horizontal piping. In the case of the conveying gas being a volatile hydrocarbon from a pressure reduction step, there will be a high rate of gas and the increased pressure drop will not be a concern. In this case it may be acceptable to use inclined piping.
Elbows should be minimized. As indicated earlier elbows cause particles to stop flowing until they are reaccelerated. The motive force for this reacceleration must come from the conveying gas which creates an increased pressure drop.
In addition to these guidelines, considerations for the design of a sampling system are often of interest. In order to obtain representative samples of the solid being conveyed, criteria are necessary. Two alternate sampling design are possible.
In the first alternative the sample is taken from a well dispersed stream of gas and solids. The solids must have obtained uniform dispersion in the flowing gas stream. This can often require 30-50 diameters of length following the injection of solids. The second criterium is somewhat more difficult to achieve. The sample line itself should extend into the center of the conveying line and the inlet should point directly into the flowing stream. In addition, the velocity in the sampling line going to the sample cyclone (or other solids-gas separator) should be designed for the same velocity as the actual gas velocity in the conveying line.
A second approach is to install a sampling device on the outside curve of an elbow. At this point the solids will be sliding along the elbow. If particle size distribution is important, this approach may give false results.
LABORATORY EVALUATIONS AND SCALEUP
The correlations to determine saltation velocity are dependent on factors such as particle shape, particle density, and small particle agglomeration that have a wide degree of error. As indicated earlier this often forces experts to use small scale testing. Using transparent pipe, it is relatively easy to spot the point of uniform solids flow. If it is not possible to obtain a visualize observation of the solids flow, a technique based on the above description and shown in Figure 5 can be utilized. As indicated earlier, to obtain the desired flow regime of fully suspended, the velocity should be increased by 30% or more. With velocities developed in a laboratory experiment the scaleup criteria for a commercial design must be developed. Based on the proprietary correlations discussed earlier, the scaleup is probably best done keeping the laboratory velocity constant in the commercial plant. This will likely result in a lower pressure drop in the commercial plant than observed in the laboratory for the identical piping configuration.
SUMMARY
While the science involved in dilute phase transfer is evolving, this paper provides some exposure for the non-expert to this critical area. I would be interested in running my model on any set of actual data on a pro bono basis. This will provide additional credibility for the model as well as some potential improvement areas for you.
TABLE 1
IMPACT OF SOLIDS RATE ON PRESSURE DROPBASED ON PROPRIETARY RELATIONSHIP
ITEM
Solids Rate pph
12000
14000
16000
18000
20000
Saltation Velocity fps
43
47
52
56
60
Inlet Gas Velocity fps
87
86
85
83
83
Solids Velocity fps
74
73
72
71
70
Total Calculated Pressure Drop psi
2.7
3.0
3.2
3.5
3.7
Acceleration Head psi
0.2
0.2
0.2
0.2
0.2
Ratio of Total Pressure Drop to Gas Only Pressure Drop in
Elbows
5.7
6.5
7.3
8.1
8.8
Horizontal Pipe
1.5
1.6
1.7
1.8
1.9
Vertical Pipe
1.9
2.0
2.2
2.3
2.5
TABLE 2
BASIS FOR CALCULATIONS
Operating Conditions unless variable is used as independent variable
Gas Flow – 9000 pph
Solids Flow – 20000 pph
Particle Size – Spherical with 700 microns average diameter
Particle Density – 51.7 lbs/ft 3
Particle Size Distribution – The assumed particle size distribution is such that d 15.9 /d 50 equals 0.42.
Where d 15.9 = The size particle that 15.9 % of particles are smaller than and d 50 represents the medium particle size.
Discharge Pressure – 0.2 psig
Piping System Basis
Horizontal Length – 400 feet
Vertical Rise – 100 feet
Number of elbows – 10
Pipe ID – 8 inch