
S-curves, also known as sigmoid, logistic, or cumulative probability curves, are mathematical models widely used in probabilistic decision analyses to represent the full range of possible results of a project or decision. Decision trees or a probabilistic model can be used to develop S-curves.
Creating an effective S-curve first involves assessing the variables (uncertainties) associated with the analysis. The range of possible outcomes for each variable must be considered in the evaluation and is best estimated using Subject Matter Experts where available. Decision Analysis recommends using a confidence interval of P10-P50-P90 for each variable.
When presented with S-curves for the first time, the temptation is to ask, “Where are we on that curve?” The answer of course is, “If you make that decision or adopt the strategy represented by that curve, you own the entire curve.” The curve represents all the possible outcomes of that decision or strategy. This feature is very powerful in decision making in that multiple S-curves can be shown on the same chart effectively comparing the full range of possible outcomes of each decision choice.
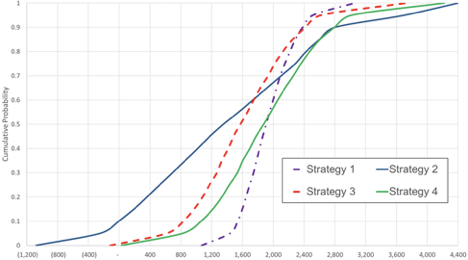
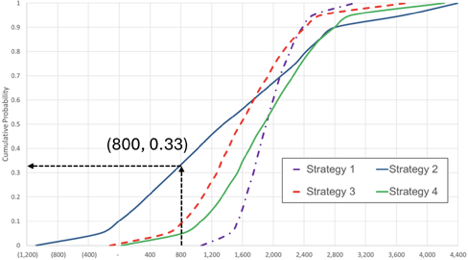
As shown in the chart below, the value of interest (NPV, IRR, etc) is shown on the x-axis and the cumulative probability is shown on the y-axis. The “cumulative probability” aspect of the y-axis can be confusing, and the probability of an x-axis value occurring cannot be read off the y-axis per se. For example, in the graph below, the value of 800 on the x-axis for the blue Strategy 2 S-curve corresponds to a cumulative probability of 33% on the y-axis. This means that Strategy 2 has a 33% probability of having a value of 800 or below. Conversely, it also means that Strategy 2 has a 67% probability of having a value above 800. Since the y-axis is a cumulative probability, the full value of the curve below or above the point of interest must also be included.
As mentioned, S-curves can be created using decision trees, but that severely limits the number of variables that can be considered. The above curves were created using a full probabilistic analysis colloquially known as “Monte Carlo Simulation”. That moniker is not fully accurate as it refers to the random number sampling technique, not to the probabilistic simulation, but it is still widely used in industry.
The S-curve is inherently different from a deterministic analysis output which provides only a single number – a “most likely” – result. Simplistically thinking, the probabilistic analysis is equivalent to running a statistically significant number of deterministic trials while randomly modifying the inputs in each trial according to the probability ranges assessed for each variable. The S-curve is the graph of the full range of probable “answers”. The strength of the S-curve is in illustrating the range of possible outcomes and the probability of the outcome being above or below a number. The S-curve provides much more information than a deterministic output.
The “heads” and “tails” of the S-curves can also provide valuable insight into what causes above or below average results. By examining the data set for the S-curves and the Tornado Diagram which identifies the most important variables, the decision maker can determine which variables are most critical. This provides an opportunity to use Value of Information or Value of Control tools on the critical variables. These tools can illustrate pathways toward improving the overall value of the strategy by influencing or gathering more information on the variables.
Conclusion
S-curves are powerful tools in decision analysis. While requiring modeling expertise and subject matter expert assessment of the uncertainties, the effort is well worth the additional time or cost given the added level of insight gained. Especially in complex or dynamic environments, the use of S-curves can assist decision makers to make informed, forward-looking decisions.
Rosnik Solutions consultants have built probabilistic models and performed analyses for many different types of projects. We have also taught probabilistic analyses courses. Let us know if you have questions or would like training in this area or assistance with your projects.